|
|
|
|
|
|
|

|
|
|
|
|
|
|
|
|
| Automated EMI Receivers |
|
|
 |
|
|
Dynamic Sciences International is no longer in business, webpage will be updated ASAP
|
EMI Test Measurement Receiver System |
||||||||
|
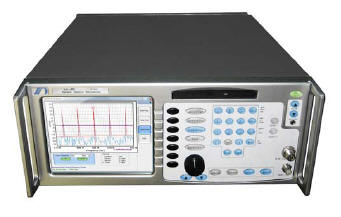
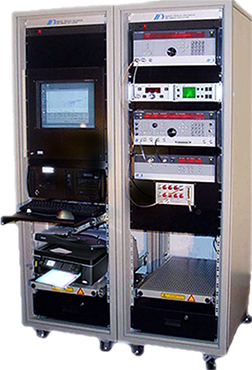
DSI 600 Series
Model 600-02 20 Hz to 2.0 GHz
Model 600-04 20 Hz to 4.0 GHz
Model 600-12 20 Hz to 12.5 GHz
Model 600-27 20 Hz to 26.5 GHz
Model 600-40 20 Hz to 40 GHz
System includes the following: MIL-461 Standard Software Test and Auto Test Generator Antenna Mast and Turntable Controller Software Operators and Users Manual One Year Warranty and Calibration DSI-600 receiver is: Fully Compliant with CISPR 16-1 Fully Compliant with MIL-STD 461E/462D Compatible in the following required test standards: CISPR 25, Second Edition 2002-08 CISPR 12, Fourth Edition 1997-05 MIL-STD-461A-G RTCA DO-160A-G
|
The DSI 600 EMI Test Measurement Receiver System is a step into the future of fully compliant test capabilities integrated into a powerful receiver technology coupled with the computational strength of the on board computer which facilitates high speed data acquisition, an enhanced spectral display module, and SCPI interoperability interface all complemented by DSII's EMIT software.
IF/RF spectrum analysis & time domain capabilities provide an all-in-one multi-functional resource rapidly and accurately providing consolidated concise test results and reports.
|
|||||||
Automated TEMPEST & EMI Test Systems |
||||||||||||||||||||||||||||||||||||||||||||||||||||||||||||||||||||||||||||||||||||||||||||||||||
|
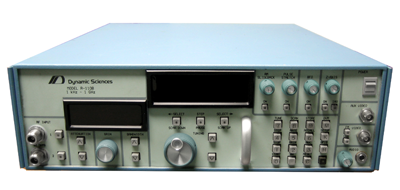
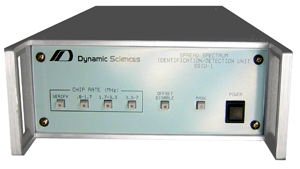
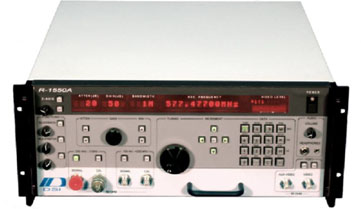
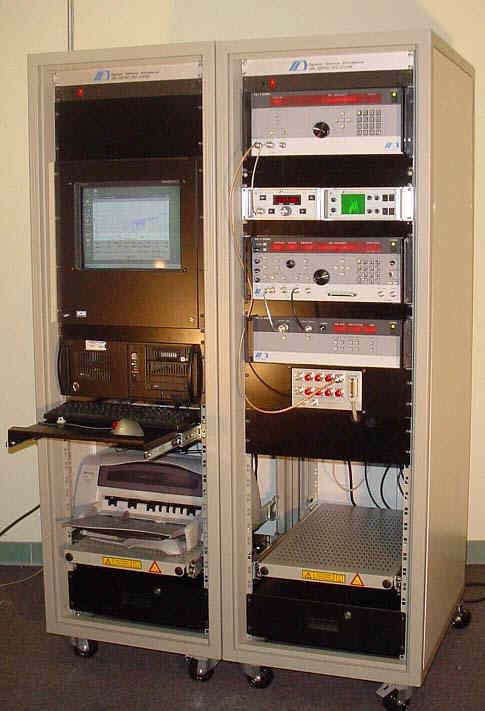
DSI-1550B TEMPEST Test System 100 Hz to 2 GHz
extendable to
20 Hz to 40 GHz
with converters Sales Restricted to NATO Countries Only
The R-1550B TEMPEST Receiver includes everything you need to operate from a frequency range of 100 Hz to 2 GHz. With options, the frequency range may be extended as low as 20 Hz or as high as 40 GHz. |
The DSI-1550B TEMPEST Test Receiver is a PC based automated receiving system that permits precision measurements, test and analysis associated with surveillance. TEMPEST or EMI/EMC. The operation provides the user with manual and automatic receiver functions, and user friendly software that gives the user straight forward access to control sophisticated data reduction algorithms and displays. The standard DSI-1550B configuration,that Dynamic Sciences offers is an extensive library of software and hardware accessories that will allow tailoring of a system to specific applications. Features:
|
|||||||||||||||||||||||||||||||||||||||||||||||||||||||||||||||||||||||||||||||||||||||||||||||||
|
|
||||||||||||||||||||||||||||||||||||||||||||||||||||||||||||||||||||||||||||||||||||||||||||||||||
|
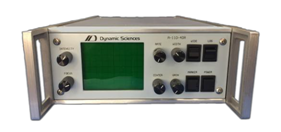
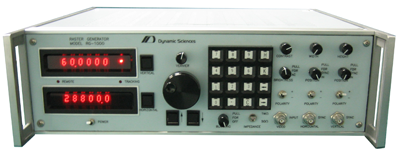
DSI-1550B System
10 Hz to 1.0 GHz extendable to 40 GHz with converters
|
The DSI-1550B is a PC based automated receiving system that permits precision measurement, test and analysis associated with surveillance, TEMPEST or EMI/EMC. Complete manual and automatic receiver operation is provided, and user friendly software allows straightforward access to and control of a suite of sophisticated data reduction algorithms and displays. In addition to the standard DSI-1550 configuration, Dynamic Sciences offers an extensive library of software and hardware accessories that will allow tailoring of a system to specific applications.
Sales Restricted to NATO Countries Only |
|||||||||||||||||||||||||||||||||||||||||||||||||||||||||||||||||||||||||||||||||||||||||||||||||
|
||||||||||||||||||||||||||||||||||||||||||||||||||||||||||||||||||||||||||||||||||||||||||||||||||
|
Copyright © 2001- R. A. Mayes Company, Inc. An Electro Mechanical Research and Development (EMRAD) Corporation, Company See our Privacy Policy All the data files on our website require Adobe Acrobat Reader! |