|
|
|
|
|
|
|

|
|
|
|
|
|
|
|
|
| 3D EM Radiation Visualization |
 |
 |
|
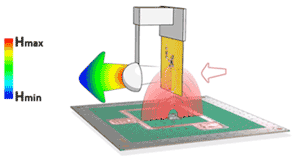
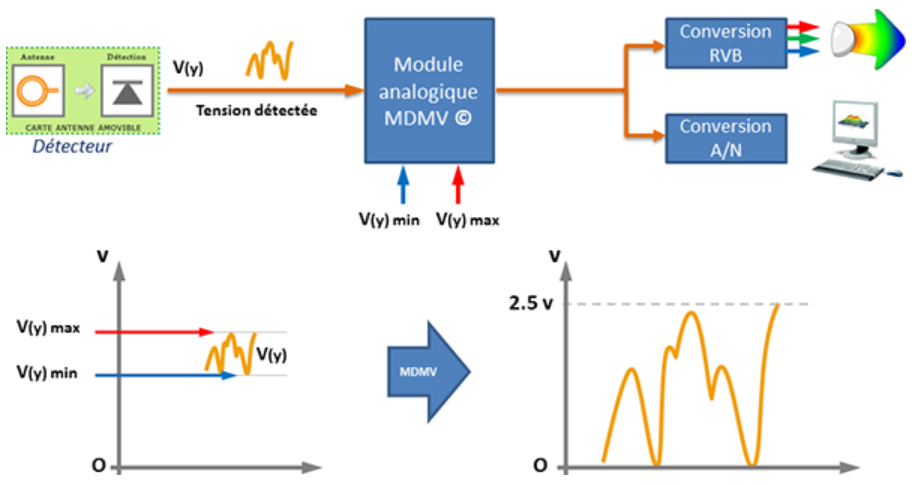
Real Time Visualization of Radio WavesLuxondes imagines, develops and manufactures, real-time measurement and visualization tools for electromagnetic fields, making the scientific message accessible around the treatment and analysis of electromagnetic waves. Born from the ambition of two passionate experts in physics and innovation, Luxondes imagines, develops and manufactures realistic measurement and visualization tools for electromagnetic fields. These real-time visualization tools convert electromagnetic waves into visible color information in a chromatic range that varies according to their intensity. Destined for the worlds of industry, research and education, Luxondes solutions are designed to make electromagnetic wave processing and analysis accessible. The study and the realization of the different systems presented by Luxondes are the fruit of a close collaboration with the LEOST/COSYS laboratory of the Gustave Eiffel University. Technology MDMV Conversion Conversion Module
MDMV Module |
||
LUXONDES SCANPHONE | ||||||||||||||||||||||||||||
|
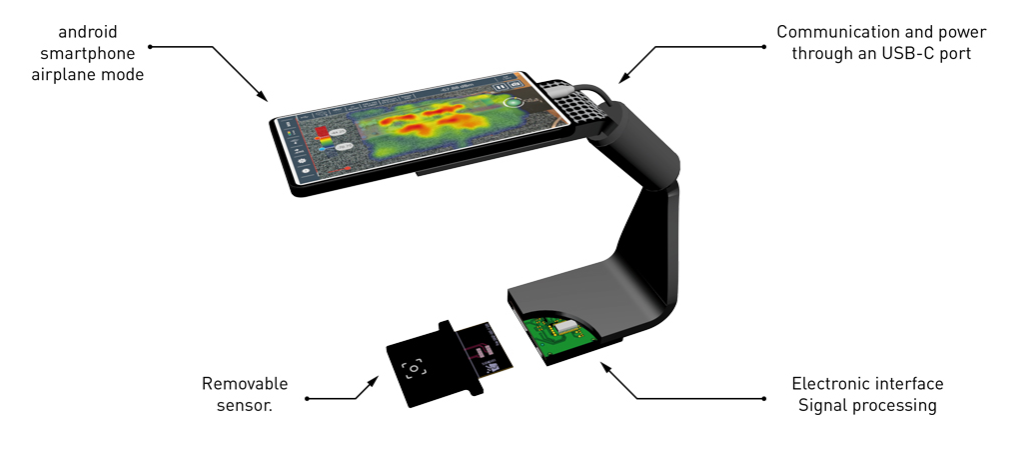
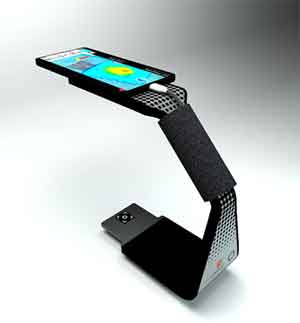
Mapping or scanning the electromagnetic emissions of electronic cards or any environment requires the use of relatively complex mechanical or electronic devices. Being autonomous, compact and fast, the ScanPhone aims to overcome these constraints. It makes it possible to map the electromagnetic environment directly on site or in locations difficult to access, such as inside a vehicle for example. This scanner, using augmented reality technology for part of its software, is composed of a smart phone coupled to removable EM field sensors to allow multiple measuring configurations.
APPLICATIONS The scanphone is sold with 2 sensors of
your choice.
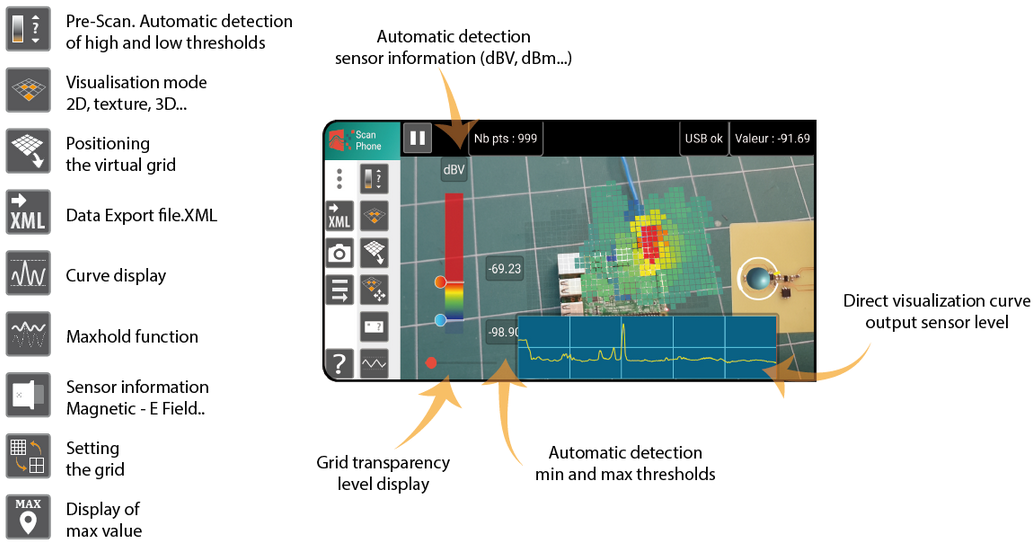
ScanPhone Graphical Interface
YouTube Instructional Video Links: Full ScanPhone instructional Video!
"See" Electromagnetic Radiation in Real Time!
Example: mapping low frequency
a radiation of a transformer (50 Hz)
Example: mapping a surface of a electronic card Sensor type: G02 (Magnetic field)
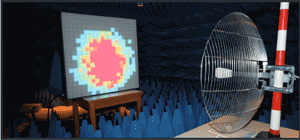
Example: Mapping the radiation of a antenna ( 2 GHz ) Sensor type: G04 (electric field) Bandwidth: 300 MHz - 7 GHz Unit: mV ( sensor output )
Example: Projection of mapping on TV Video Player With the broadcast function of the smartphone, it is possible to project the screen on a compatible TV. (EasyCast VDO projector)
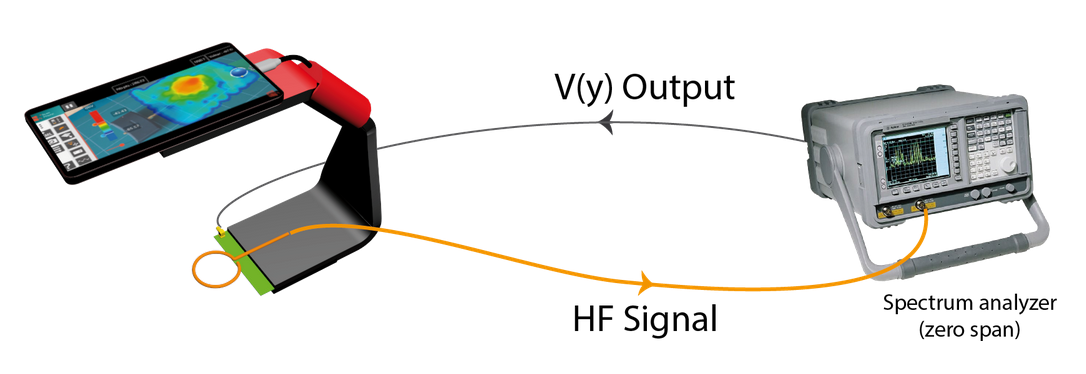
Example: radiation shielding defect - with spectrum analyzer Example of mapping a shield fault of an HF cable. The sensor is here replaced by the detection part of a spectrum analyzer (Selection Fr.Centrale; SweepTime; RBW; Span Zero Mode). Output option V (y) out.
Example: Planar mapping Sensor type: G04 (electric field) Bandwidth: 300 MHz - 7 GHz Unit: mV ( sensor output )
Example: Mapping the magnet of a levitron
The levitron is a spinning top which levitates above a magnet.
How it works? Step 1: A detailed video of the process required for the ScanPhone to display radiation from a Raspberry. To be able to position a virtual grid above the equipment under test (EUT), the augmented reality algorithm implemented in our smartphone computes a large number of reference points over the surface of the EUT to be scanned. This step is automatically lanched with our application and last a fews seconds.
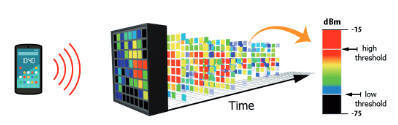
Step 2: Activation of the prescan function finds the min and max values over the surface to be scanned. At the end of the prescan, our module MDMV uses these values in order to optimize the dynamic output. |
||||||||||||||||||||||||||||
LUXONDES RADIO WAVES DISPLAY 400 |
|
LUXONDES RWD - 400 Radio Waves Display 400 The Luxondes radiofrequency to optical conversion panel directly displays the ambient EM-field or the radiation of a transmitting DUT that is placed in front of it. It comprises 400 (20x20) autonomous identical sensors working as elementary visualization pixels. The representation of the EM field is provided through a gradient of colors. On the side of the panel you can change the sensitivity and dynamics of the system. APPLICATION FEATURES
|
LUXONDES RADIO WAVES DISPLAY 64 - PC (RWD- 64PC) |
|
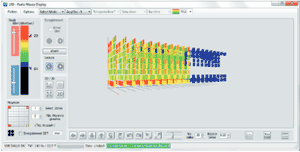
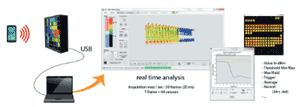
Radio Waves Display 64 - PC (RWD-64PC)
3D visualization software and data analysis. Recording format .dat .bin
The LUXONDES Radio Waves Display 64 - PC (RWD-64PC) system is for the measuring and visualizing of electromagnetism radiation. It includes 64 sensors operating between 50 MHz and 3 GHz. Bidirectional communication (USB) is established between all sensors and a PC. This one allows to adjust in real time the sensitivity and the dynamics as well as the speed of acquisition. The software developed allows the recording and the reading of the data as well as an in-depth analysis of the results. Fast and easy to adjust, the RWD saves time in antenna radiation pattern optimization, or quality control; for example in the analysis of communication signals of connected objects or in the study of the focusing of waves (time reversal, 5G communication).It is an ideal didactic tool for teaching and a powerful communication tool for present scientific work based on electromagnetic radiation. APPLICATION
|
LUXONDES GYROSCANFIELD |
|
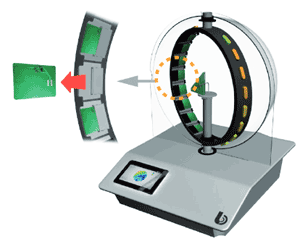
LUXONDES GyroScanField
The Gyroscanfield is a 3D, real-time
measuring equipment whose function is to directly visualize the
electromagnetic radiation of a Device Under Test (DUT) in a simple
and fast way. 16 sensors with detachable antennas are spread over a
60 cm diameter ring. A set of different antennas is available
corresponding to your requested frequency and sensitivity ranges.
Each elementary sensor around the loop converts the electromagnetic
received energy in a corresponding calibrated range of visible
colors by using RGB LEDs. Each sensor has an A/D converter for
backup and data mining.
APPLICATIONS ADVANTAGES • Direct visualization of the electromagnetic field, either continuous wave or, modulated at frequencies up to several tens of μs. • Sensors compatible with detachable antennas and the range of products from LUXONDES. • Fast acquisition speed
FEATURES • Size : (H) 100 x (L) 75 x (P) 85 cm • Support roller : (H) 85 cm • Rotation speed : 15 Turns /sec max. • Acquisition : 720 Points / Turn / Sensor • Power supply : 230 VAC 50 Hz
|
|
Copyright © 2001- R. A. Mayes Company, Inc. An Electro Mechanical Research and Development (EMRAD) Corporation, Company See our Privacy Policy All the data files on our website require Adobe Acrobat Reader! |